lumnik. / scenarios All scenarios · Français

A frozen ERP feeds a real Grafana dashboard

Goal Give management an up-to-date sales dashboard from the exports of an ERP nobody touches any more.

The ERP exports its sales and its catalogue as CSV. lumnik joins them, and Grafana reads the entity through a read-only PostgreSQL account, bounded to its tenant.

products.csv
product_id,product_name,category
P-100,Laptop Pro 14,Computing
P-200,27-inch Monitor,Computing
P-300,Standing Desk,Furniture
P-400,Ergonomic Chair,Furniture
sales-monday.csv
sale_id,sale_date,order_no,product_id,quantity,amount,status
SALE-001,2026-10-19,SO-1001,P-100,2,4000.00,NEW
SALE-002,2026-10-19,SO-1002,P-200,5,1500.00,SHIPPED
SALE-003,2026-10-19,SO-1003,P-300,3,1800.00,PREPARING
SALE-004,2026-10-19,SO-1004,P-400,8,1200.00,PREPARING
SALE-005,2026-10-19,SO-1005,P-100,1,1500.00,NEW
SALE-006,2026-10-19,SO-1005,P-200,1,450.00,SHIPPED
manifests/30-sale-with-category.yaml
kind: Entityname: SaleWithCategoryBdescription: Legacy ERP sales enriched with product and category labels for BI.match: [sale_id]scopes: [sales-bi]sources:  - table: t_legacy_bi_sales_b    map:      sale_id: sale_id      sale_date: sale_date      order_no: order_no      product_id: product_id      quantity: quantity      amount: amount      status: statusjoins:  - table: t_legacy_bi_products_b    from: product_id    to: product_id    map:      product_name: product_name      category: category
boundary
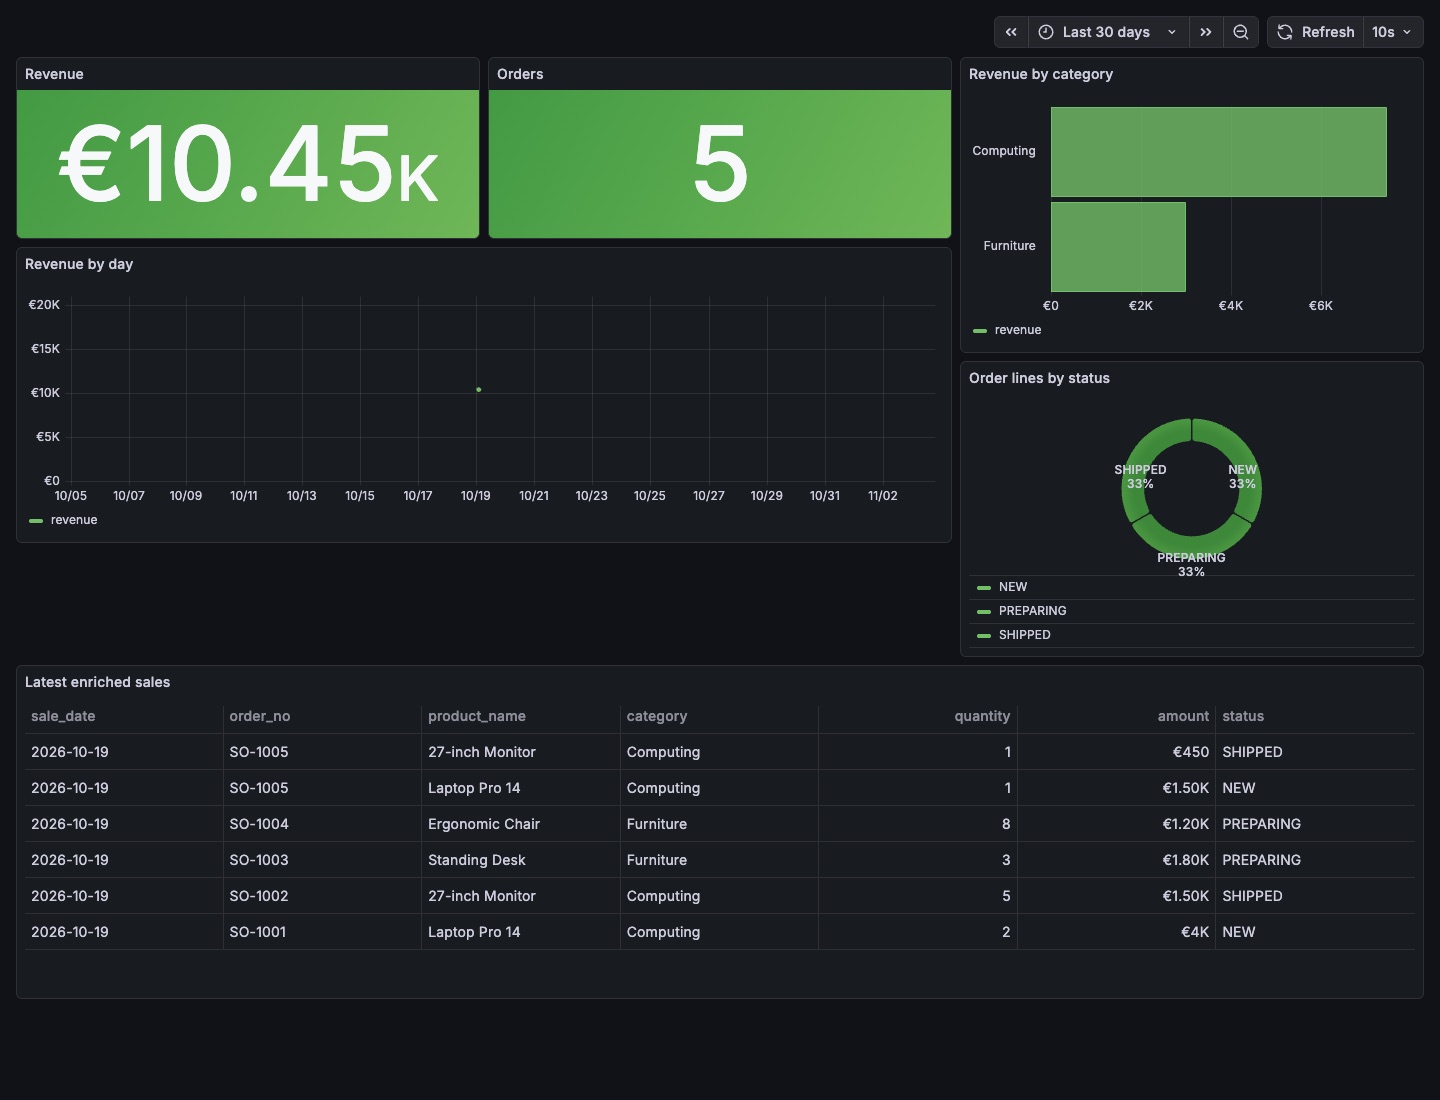
Monday KPIs visible, unrelated relations denied, cross-tenant override denied
reader KPIs
6 lines · 5 orders · EUR 10450.00
grafana
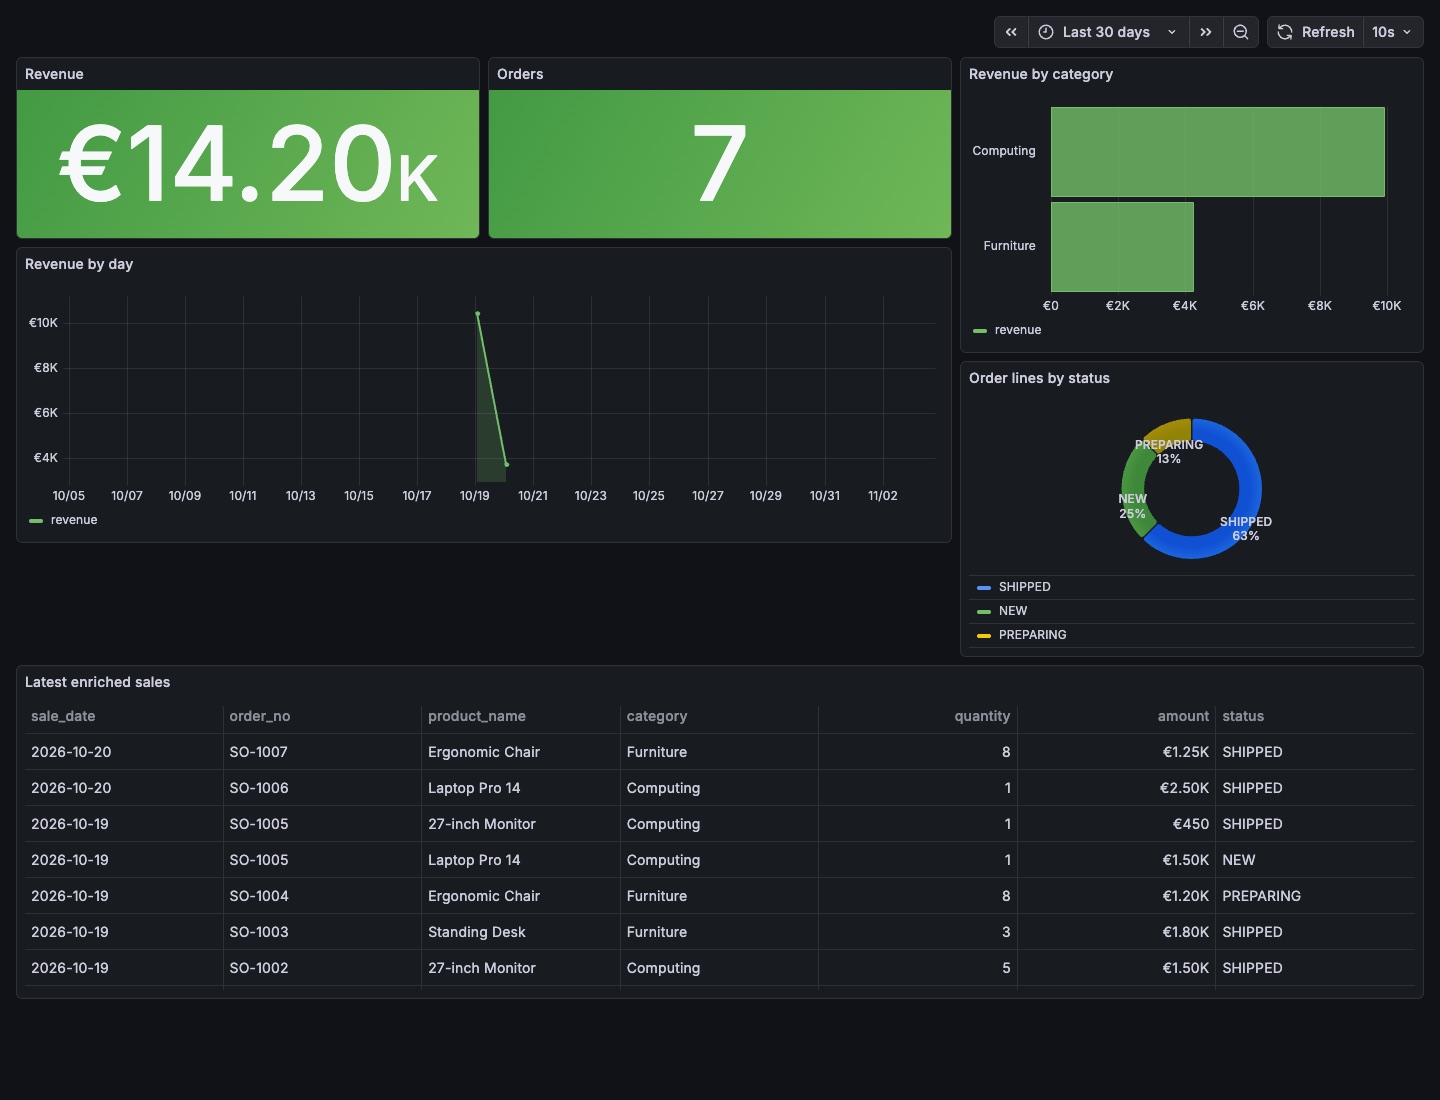
datasource, six panels and expected KPIs are live

evidence: replay.log, kpis-monday.csv, kpis-tuesday.csv, reader-boundary.txt, sale-003-tuesday.txt · transform v1

sales-tuesday.csv
sale_id,sale_date,order_no,product_id,quantity,amount,status
SALE-001,2026-10-19,SO-1001,P-100,2,4000.00,NEW
SALE-002,2026-10-19,SO-1002,P-200,5,1500.00,SHIPPED
SALE-003,2026-10-19,SO-1003,P-300,3,1800.00,SHIPPED
SALE-004,2026-10-19,SO-1004,P-400,8,1200.00,PREPARING
SALE-005,2026-10-19,SO-1005,P-100,1,1500.00,NEW
SALE-006,2026-10-19,SO-1005,P-200,1,450.00,SHIPPED
SALE-007,2026-10-20,SO-1006,P-100,1,2500.00,SHIPPED
SALE-008,2026-10-20,SO-1007,P-400,8,1250.00,SHIPPED

Limits

  • Grafana queries PostgreSQL at an interval; this is not streaming.
  • The reading login is created for the demonstration; in production its credentials belong in a secret manager, with the same boundary.
  • The login reads tables of the connector schema: a change to the view means revisiting its grants.
  • Synthetic data.

Sales · dashboard

Management wants a sales dashboard.

The ERP no longer changes.

All it can do is export its sales and catalogue as CSV.

Fictional ERP · synthetic data

The problem

Sales and products sit in two files.

  • A sale carries a product id, not its category.
  • Every morning the export replaces yesterday's.
  • Grafana does not read a changing CSV.

Nothing is changed

The ERP exports as before.

  • Two CSV files, as they are.
  • Grafana keeps its PostgreSQL source.
  • No Grafana connector to write.

What had to be written

joins:
  - table: t_legacy_bi_products_b

A join gives each sale its category.

A 71-line scenario, three declaration files.

Monday, then Tuesday

€10,450, then €14,200.

  • Monday: 6 lines, 5 orders.
  • Tuesday: 8 lines, 7 orders.
  • SALE-003 becomes SHIPPED, once.

Replay of 3 November 2026.

Who reads what

Grafana reads, and only its tenant.

  • A read-only PostgreSQL role.
  • SELECT on the view and its two tables.
  • A policy keeps it in its tenant.

The limit

This is not streaming.

  • Grafana queries PostgreSQL at intervals.
  • Credentials belong in a secret manager.
  • A change to the view means reviewing the grants.

Try it

The scenario replays end to end.

CSV, entity, reader account, Grafana: every step is published with its output.

This scenario runs on lumnik Open, free and open source.

Try lumnik Open →